
Page 17 - Masazi Solutions
P. 17
Communicating Data for Impact
Charts to use in Data Visualization
• Scatter Plot
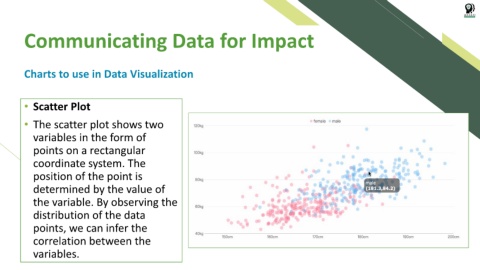
• The scatter plot shows two
variables in the form of
points on a rectangular
coordinate system. The
position of the point is
determined by the value of
the variable. By observing the
distribution of the data
points, we can infer the
correlation between the
variables.