
Page 19 - Masazi Solutions
P. 19
Communicating Data for Impact
Charts to use in Data Visualization
• Maps
• The map is divided into three
types: regional map, point
map, and flow map.
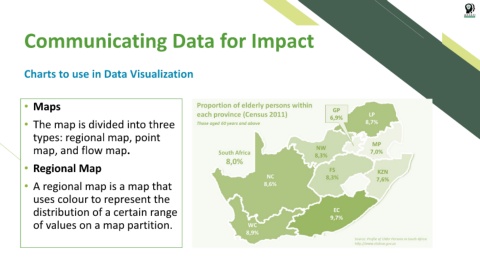
• Regional Map
• A regional map is a map that
uses colour to represent the
distribution of a certain range
of values on a map partition.