
Page 13 - Masazi Solutions
P. 13
Communicating Data for Impact
Charts to use in Data Visualization
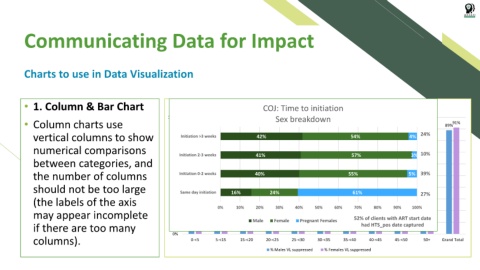
• 1. Column & Bar Chart COJ: Time to initiation
VL suppression by age and gender
Sex breakdown
• Column charts use 100% 88% 90% 89% 88% 90% 88% 91% 89% 92% 90% 93% 91% 94% 89% 91%
90%
vertical columns to show 80% Initiation >3 weeks 79% 42% 77% 54% 4% 24%
81% 82%
80%
78%
numerical comparisons 70% Initiation 2-3 weeks 73% 41% 57% 3% 10%
between categories, and 60%
the number of columns 50% Initiation 0-2 weeks 40% 55% 5% 39%
should not be too large 40% Same day initiation 16% 24% 61% 27%
(the labels of the axis 30%
80%
70%
90%
100%
may appear incomplete 20% 0% 10% 20% 30% 40% 50% 60% 52% of clients with ART start date
if there are too many 10% Male Female Pregnant Females had HTS_pos date captured
columns). 0% 0-<5 5-<15 15-<20 20-<25 25-<30 30-<35 35-<40 40-<45 45-<50 50+ Grand Total
% Males VL suppressed % Females VL suppressed