
Page 18 - Masazi Solutions
P. 18
Communicating Data for Impact
Charts to use in Data Visualization
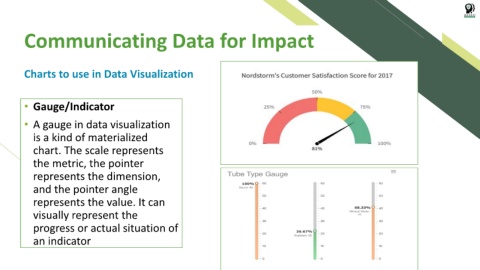
• Gauge/Indicator
• A gauge in data visualization
is a kind of materialized
chart. The scale represents
the metric, the pointer
represents the dimension,
and the pointer angle
represents the value. It can
visually represent the
progress or actual situation of
an indicator