
Page 20 - Masazi Solutions
P. 20
Communicating Data for Impact
Charts to use in Data Visualization
• Maps
• The map is divided into three types:
regional map, point map, and flow map.
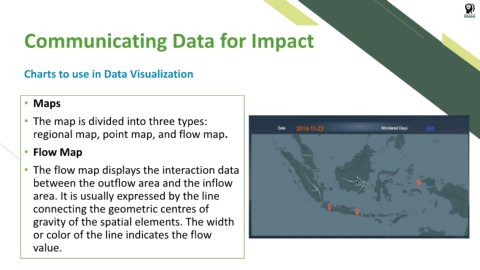
• Flow Map
• The flow map displays the interaction data
between the outflow area and the inflow
area. It is usually expressed by the line
connecting the geometric centres of
gravity of the spatial elements. The width
or color of the line indicates the flow
value.