Page 16 - Masazi Solutions
P. 16

Communicating Data for Impact


           Charts to use in Data Visualization
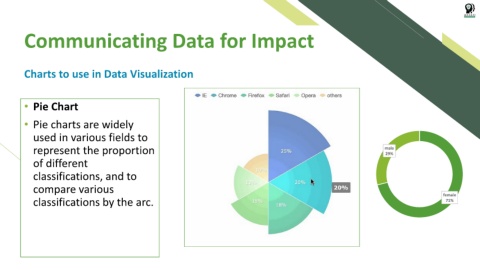


           • Pie Chart


           • Pie charts are widely

              used in various fields to


              represent the proportion                                                                                                                     male
                                                                                                                                                           29%
              of different

              classifications, and to

              compare various

              classifications by the arc.                                                                                                                                         female
                                                                                                                                                                                   71%
   11   12   13   14   15   16   17   18   19   20   21