
Page 15 - Masazi Solutions
P. 15
Communicating Data for Impact
Charts to use in Data Visualization
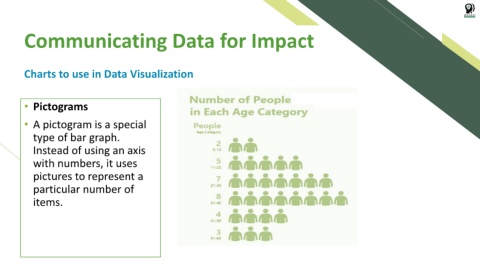
• Pictograms
• A pictogram is a special
type of bar graph.
Instead of using an axis
with numbers, it uses
pictures to represent a
particular number of
items.