
Page 25 - Masazi Solutions
P. 25
Communicating Data for Impact
Visualization Best Practices
• Consider your audience
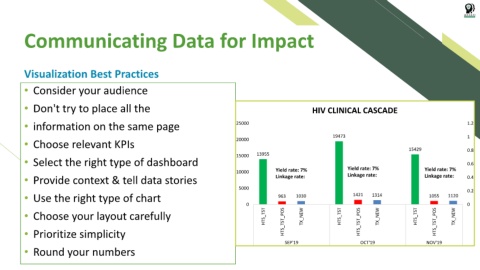
• Don't try to place all the HIV CLINICAL CASCADE
• information on the same page 25000 1.2
19473 1
• Choose relevant KPIs 20000 15429 0.8
• Select the right type of dashboard 15000 13955 0.6
10000 Yield rate: 7% Yield rate: 7% Yield rate: 7%
Linkage rate:
• Provide context & tell data stories Linkage rate: Linkage rate: 0.4
5000 0.2
• Use the right type of chart 963 1030 1421 1314 1055 1120
0 0
• Choose your layout carefully HTS_TST HTS_TST_POS TX_NEW HTS_TST HTS_TST_POS TX_NEW HTS_TST HTS_TST_POS TX_NEW
• Prioritize simplicity
SEP'19 OCT'19 NOV'19
• Round your numbers