
Page 29 - Masazi Solutions
P. 29
Communicating Data for Impact
Visualization Best Practices – Use Imagery/Icons
1 90 2 nd 90 3 90
st
rd
HTS ART VLS
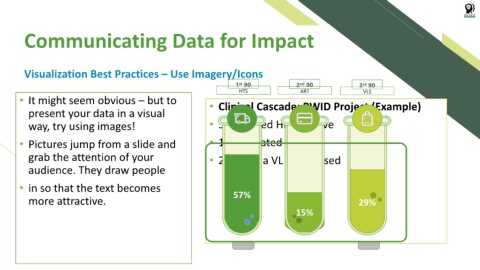
• It might seem obvious – but to • Clinical Cascade: PWID Project (Example)
present your data in a visual
way, try using images! • 57% Tested HIV positive
• Pictures jump from a slide and • 15% Initiated on ART
grab the attention of your • 29% had a VL suppressed
audience. They draw people
• in so that the text becomes
more attractive. 57% 29%
15%