
Page 27 - Masazi Solutions
P. 27
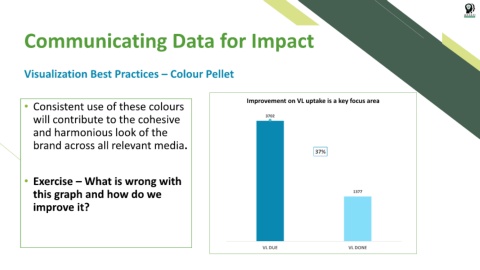
Communicating Data for Impact


           Visualization Best Practices – Colour Pellet


           • Consistent use of these colours                                          4000          Improvement on VL uptake is a key focus area                   40%
                                                                                                               VL Due vs VL Done
              will contribute to the cohesive                                          4000             3702 3702                                   40%

              and harmonious look of the                                              3500                                                          35%            35%
                                                                                       3500
              brand across all relevant media.                                        3000                                                          30%            30%
                                                                                       3000
                                                                                                                            37% 37%
                                                                                      2500                                                          25%            25%
                                                                                       2500

           • Exercise – What is wrong with                                            2000                                                          20%    VL Uptake 20%
                                                                                       2000
                                                                                                                                                           VL Uptake rate
              this graph and how do we                                                1500                                         1377       1377  15%            15%
                                                                                       1500

              improve it?                                                             1000                                                          10%            10%
                                                                                       1000

                                                                                        500                                                         5%
                                                                                       500                                                                         5%
                                                                                          0                                                         0%
                                                                                         0              VL DUE                    VL DONE                          0%
                                                                                                          VL DUE                            VL DONE