Page 28 - Masazi Solutions
P. 28

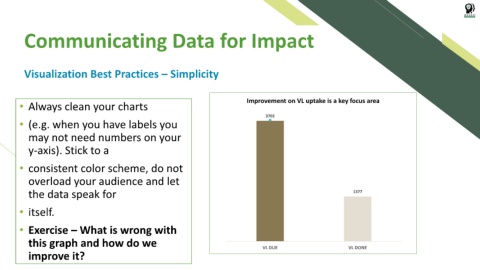
Communicating Data for Impact


           Visualization Best Practices – Simplicity


         • Always clean your charts                                                   4000          Improvement on VL uptake is a key focus area                   40%
                                                                                                               VL Due vs VL Done
                                                                                       4000
         • (e.g. when you have labels you                                             3500              3702 3702                                   40%            35%

            may not need numbers on your                                               3500                                                         35%


            y-axis). Stick to a                                                       3000                                                          30%            30%
                                                                                       3000
                                                                                      2500                                  37%                     25%            25%
                                                                                       2500
         • consistent color scheme, do not
            overload your audience and let                                            2000                                                          20%    VL Uptake 20%
                                                                                       2000
                                                                                                                                                           VL Uptake rate
            the data speak for                                                        1500                                         1377       1377  15%            15%
                                                                                       1500


                                                                                       1000
         • itself.                                                                    1000                                                          10%            10%
                                                                                        500                                                         5%
         • Exercise – What is wrong with                                               500                                                                         5%


            this graph and how do we                                                     0  0           VL DUE                    VL DONE   VL DONE  0%            0%
                                                                                                          VL DUE
            improve it?
   23   24   25   26   27   28   29   30   31   32   33